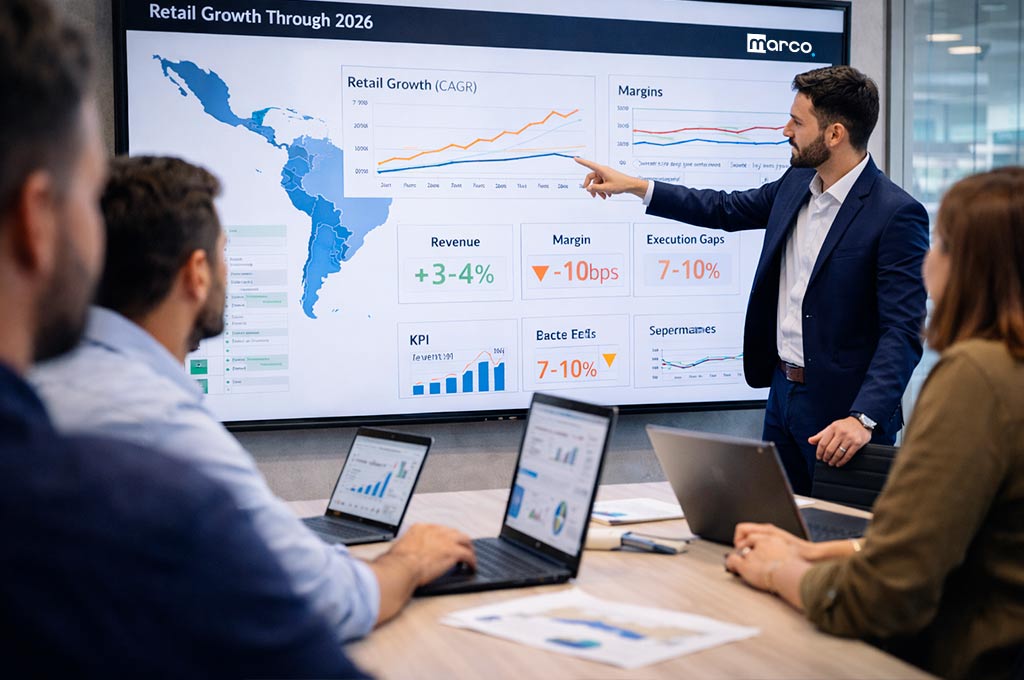


The U.S. retail landscape in 2026: growth with structural pressure
The United States remains one of the most competitive retail markets globally, but scaling in 2026 comes with structural complexity:
- Retail sales surpassed $7.4 trillion.
- Over 1 million retail outlets operate across the country.
- Field execution models cover thousands of dispersed stores across multiple formats.
- Labor cost inflation remains above 4% annually in key states.
Scaling retail execution is no longer about geographic expansion.
It is about maintaining operational precision under scale.
Why Florida matters in Trade execution
Florida represents one of the most strategic growth markets in the U.S.:
- Population growth above the national average.
- Strong Hispanic demographic influence.
- Tourism-driven consumption volatility.
- Rapid expansion of grocery and convenience chains.
- High store density in urban clusters (Miami, Orlando, Tampa).
Florida’s retail environment combines:
- High volume
- High promotional intensity
- Strong regional chains
- Diverse shopper behavior
Companies expanding field coverage in Florida without governance experience:
- Up to 10% decline in execution quality within 12–18 months.
- Higher OOS volatility during seasonal spikes.
- Promotional inefficiency due to inconsistent compliance.
Scaling in Florida without systems increases leakage.
Comparative Trade execution scale by state:
States with large-scale trade execution:
- Texas: large geography, dispersed coverage, heavy reliance on route optimization.
- California: intense competition, high labor cost, strict compliance requirements.
- Florida: dense clusters + seasonal spikes.
- Georgia and Illinois: strong regional grocery chains and hybrid formats.
Each state requires a different execution architecture.
The mistake companies make is replicating one model nationally.
Execution scale must adapt to:
- Store density
- Category mix
- Labor cost
- Competitive intensity
- Promotional calendar volatility
The hidden risk of scaling too fast:
When companies increase headcount without redesigning governance:
- Field teams grow faster than monitoring systems.
- Reporting lags behind decision cycles.
- OOS becomes structurally embedded.
- Promotional ROI declines.
Research across U.S. CPG expansion programs shows that 35–40% of multi-state expansion initiatives experience margin erosion within the first 24 months due to execution inconsistency.
Growth amplifies inefficiency.
Standardization before expansion:
To scale trade execution across Florida, Texas or California, companies must first establish:
- Unified execution playbooks
- Defined audit protocols
- Clear compliance scoring methodology
- Store clustering framework
- Escalation SLAs
Without standardized execution, expansion multiplies errors.
In high-density Florida clusters, even a 3% drop in compliance can translate into millions in lost sell-out across a 12-month period.
KPIs that matter at scale:
Activity metrics become irrelevant at scale.
Executive-level KPIs must shift toward financial impact:
- Availability weighted by sales
- Incremental revenue per store cluster
- Cost per execution point recovered
- Margin impact per promotional activation
- EBITDA contribution per state
In Florida, where seasonal tourism spikes distort volume, KPIs must be normalized against baseline traffic variability.
Scaling without adjusted KPIs creates false signals.
Technology as the scaling multiplier:
The most successful large-scale trade operations in the U.S. deploy:
- Real-time field monitoring systems
- AI-based image recognition for planogram compliance
- Predictive OOS alerts integrated with POS data
- Route optimization engines adjusted by store density
- Centralized performance dashboards segmented by state
In geographically large states like Texas, route optimization reduces travel inefficiency by up to 15%.
In dense Florida clusters, AI compliance validation increases execution accuracy by 5–8%.
Technology is not a cost.
It is a control amplifier.
Training: the most overlooked risk in scaling
As field teams expand across states:
- Cultural differences impact negotiation style.
- Store formats vary significantly.
- Competitive intensity shifts regionally.
In Florida’s Hispanic-heavy markets, bilingual communication and localized category understanding directly impact execution effectiveness.
Without structured certification programs, execution quality decays within 6–9 months.
Scaling headcount without scaling capability reduces ROI.
Financial implications of structured scaling:
Companies that scale trade execution with governance across multi-state operations achieve:
- 4–7% improvement in sell-out
- 8–12% reduction in operational leakage
- Improved promotional ROI by 5–9%
- Stabilized EBITDA during expansion cycles
Companies that scale reactively:
- Increase operational cost
- Experience OOS volatility
- Destroy promotional efficiency
- Compress margins despite revenue growth
Revenue growth without execution governance is margin dilution.
The systemic model for U.S. retail growth:
To scale effectively in the U.S., especially in high-density states like Florida, companies must integrate:
- Planogram compliance governance
- OOS monitoring and predictive alerts
- Route optimization tailored by state
- Trade investment ROI control
- Standardized performance dashboards
Retail growth is systemic.
Execution, compliance, availability and investment allocation must operate as a unified structure.
Financial Case Study:
Florida vs Texas — scaling Trade execution at multi-State level
Company Profile
- Category: Beverage CPG
- Annual U.S. Revenue: $180M
- Gross Margin: 32%
- Trade Investment: 14% of revenue
- Field Team: 120 merchandisers across 5 states
Focus states for expansion:
Florida and Texas.
Baseline Conditions:
Florida
- High store density in urban clusters (Miami, Orlando, Tampa)
- Strong seasonal volatility (tourism-driven spikes)
- Higher promotional intensity
- Shorter average travel distance between stores
- OOS volatility increases during peak season
Texas
- Large geographic spread
- Lower store density in rural areas
- Higher travel time per visit
- More regional chain fragmentation
- Higher fuel/logistics cost per rep
Scenario 1: reactive scaling (headcount growth without structural redesign)
The company increases field coverage by 20% in both states.
Florida Impact
Execution inconsistency due to:
- No predictive OOS monitoring
- No cluster-based routing
- Manual compliance validation
Results after 12 months:
- Execution compliance drops from 95% to 91%
- OOS increases from 6% to 9%
- Promotional compliance falls 4 points
Financial impact:
Annual Florida revenue: $60M
OOS increase impact (3% incremental loss):
$60M × 0.03 = $1.8M lost revenue
Margin impact (32%):
$1.8M × 0.32 = $576,000 margin loss
Additional headcount cost: $1.2M
Net margin erosion:
$1.776M
Growth increased cost but reduced profitability.
Texas Impact
Execution inefficiency driven by:
- Poor route optimization
- Increased travel time
- Lower time-in-store ratio
Field productivity drops 12%.
Revenue impact:
Texas annual revenue: $50M
Sell-out stagnates despite 20% more visits
Missed growth opportunity estimated at 4%:
$50M × 0.04 = $2M unrealized revenue
Margin opportunity loss (32%):
$640,000
Operational cost increase: $1.5M
Net margin erosion:
$2.14M
Scenario 2: structured scaling model
Before increasing headcount, the company implements:
- Cluster-based store prioritization
- AI-driven compliance validation
- Predictive OOS alerts
- Route optimization adapted per state
- State-level KPI dashboards
Florida Results (Structured Model)
OOS reduced from 6% to 4.5%
Promotional compliance improved 3 points
Sell-out growth: +5.2%
Revenue impact:
$60M × 0.052 = $3.12M incremental revenue
Margin contribution (32%):
$998,400
Incremental tech investment: $600,000
Headcount increase reduced to 10% instead of 20%
Net margin gain:
~$400,000 positive after year one
Texas Results (Structured Model)
Route optimization reduces travel time 14%.
Time-in-store increases 9%.
Sell-out growth: +4.5%
Revenue impact:
$50M × 0.045 = $2.25M incremental revenue
Margin contribution (32%):
$720,000
Fuel and travel savings: $300,000
Lower headcount growth than reactive model
Net positive margin contribution:
~$820,000
Key Differences: Florida vs Texas
| Variable | Florida | Texas |
|---|---|---|
| Main Risk | OOS volatility | Route inefficiency |
| Density | High | Medium–Low |
| Travel Time | Low | High |
| Seasonal Volatility | High | Moderate |
| Key Lever | Predictive availability | Route optimization |
Scaling must adapt to structural state differences.
Executive Insight
The same headcount increase produced:
Reactive model:
- Florida: -$1.7M margin impact
- Texas: -$2.1M margin impact
Structured model:
- Florida: +$0.4M margin gain
- Texas: +$0.8M margin gain
The difference was not revenue growth.
It was governance design.
Strategic Conclusion
In the U.S., especially across diverse states like Florida and Texas:
- Scaling headcount without redesigning execution architecture destroys margin.
- Technology and state-level segmentation determine ROI.
- Growth must be structurally differentiated by geography.
National strategy with local execution architecture wins.
Executive Takeaway:
Before approving multi-state expansion, a CEO should ask:
- What is the compliance baseline by state?
- What is the OOS weighted by sales?
- How does Florida differ structurally from Texas or California?
- What margin volatility are we introducing?
- Is technology scaling faster than headcount?
Scaling retail execution in the United States is not about coverage.
It is about scalable control.